Recently, I discovered a Grafana Dashboard that can visualize certificate validity, and it works quite well. The configuration is simple, aggregating the validity period, serial number, issuer, and other information of multiple site certificates, making it clear at a glance. I am sharing this blog post with everyone.
SSL Exporter
As we all know, Prometheus and Grafana cannot directly obtain certificate information. We need to use some Exporters to convert the information into data metrics for Prometheus, and then query it through PromQL to display it in Grafana reports. Here, we need to use the ssl_exporter developed by a great developer.
ssl-exporter can obtain SSL certificates from multiple sources:
- TCP: Automatically sniff the protocol and then obtain the certificate. According to the source code, it supports
smtp,ftp,imap,postgres,pop3. - HTTPS: This is the certificate of the HTTPS site.
- FILE: Obtain the certificate from a local file of
ssl-exporter. - HTTP FILE: Obtain the certificate file through a URL.
- k8s: Obtain the certificate from the
secretsof thekubernetes.io/tlstype in k8s. - KubeConfig: Obtain the certificate from the specified kubeconfig file.
After obtaining the SSL certificate, it will be converted into specific metrics (see the official README for details).
The project also provides a dashboard configuration, which can be imported into Grafana for use.
Below is a detailed operation guide.
Configuration
Use docker-compose to quickly start.
- File
docker-compose.yml
services:
  ssl-exporter:
  image: 'ribbybibby/ssl-exporter:latest'
  container_name: ssl-exporter
  restart: always

  prometheus:
  image: 'prom/prometheus:latest'
  restart: always
  container_name: prometheus
  ports:
    - '19090:9090'
  volumes:
    - './prometheus.yml:/etc/prometheus/prometheus.yml'
    - './promwal:/prometheus'

  grafana:
  image: grafana/grafana:latest
  container_name: grafana
  volumes:
    - './grafana/data:/var/lib/grafana'
  ports:
    - '3000:3000'
  restart: always
File
./prometheus.ymlHere is an example of the
httpsandtcpmodes. Just change thedomain:portin thetargets, as shown below with some example sites.If you need to obtain certificates from k8s or other services, you can refer to the example configuration in the official documentation.
scrape_configs:
  - job_name: "https"
  metrics_path: /probe
  params:
    module: ["https"] # <-----
  static_configs:
    - targets:
      - razeen.me:443
      - bing.com:443
      - expired.badssl.com:443
      - revoked.badssl.com:443
      - untrusted-root.badssl.com:443
      - self-signed.badssl.com:443
  relabel_configs:
    - source_labels: [__address__]
    target_label: __param_target
    - source_labels: [__param_target]
    target_label: instance
    - target_label: __address__
    replacement: ssl-exporter:9219

  - job_name: "startssl"
  metrics_path: /probe
  static_configs:
    - targets:
      - smtp.qq.com:587
      - smtp.office365.com:587
      - smtp.163.com:587
  relabel_configs:
    - source_labels: [__address__]
    target_label: __param_target
    - source_labels: [__param_target]
    target_label: instance
    - target_label: __address__
    replacement: ssl-exporter:9219 # SSL exporter.
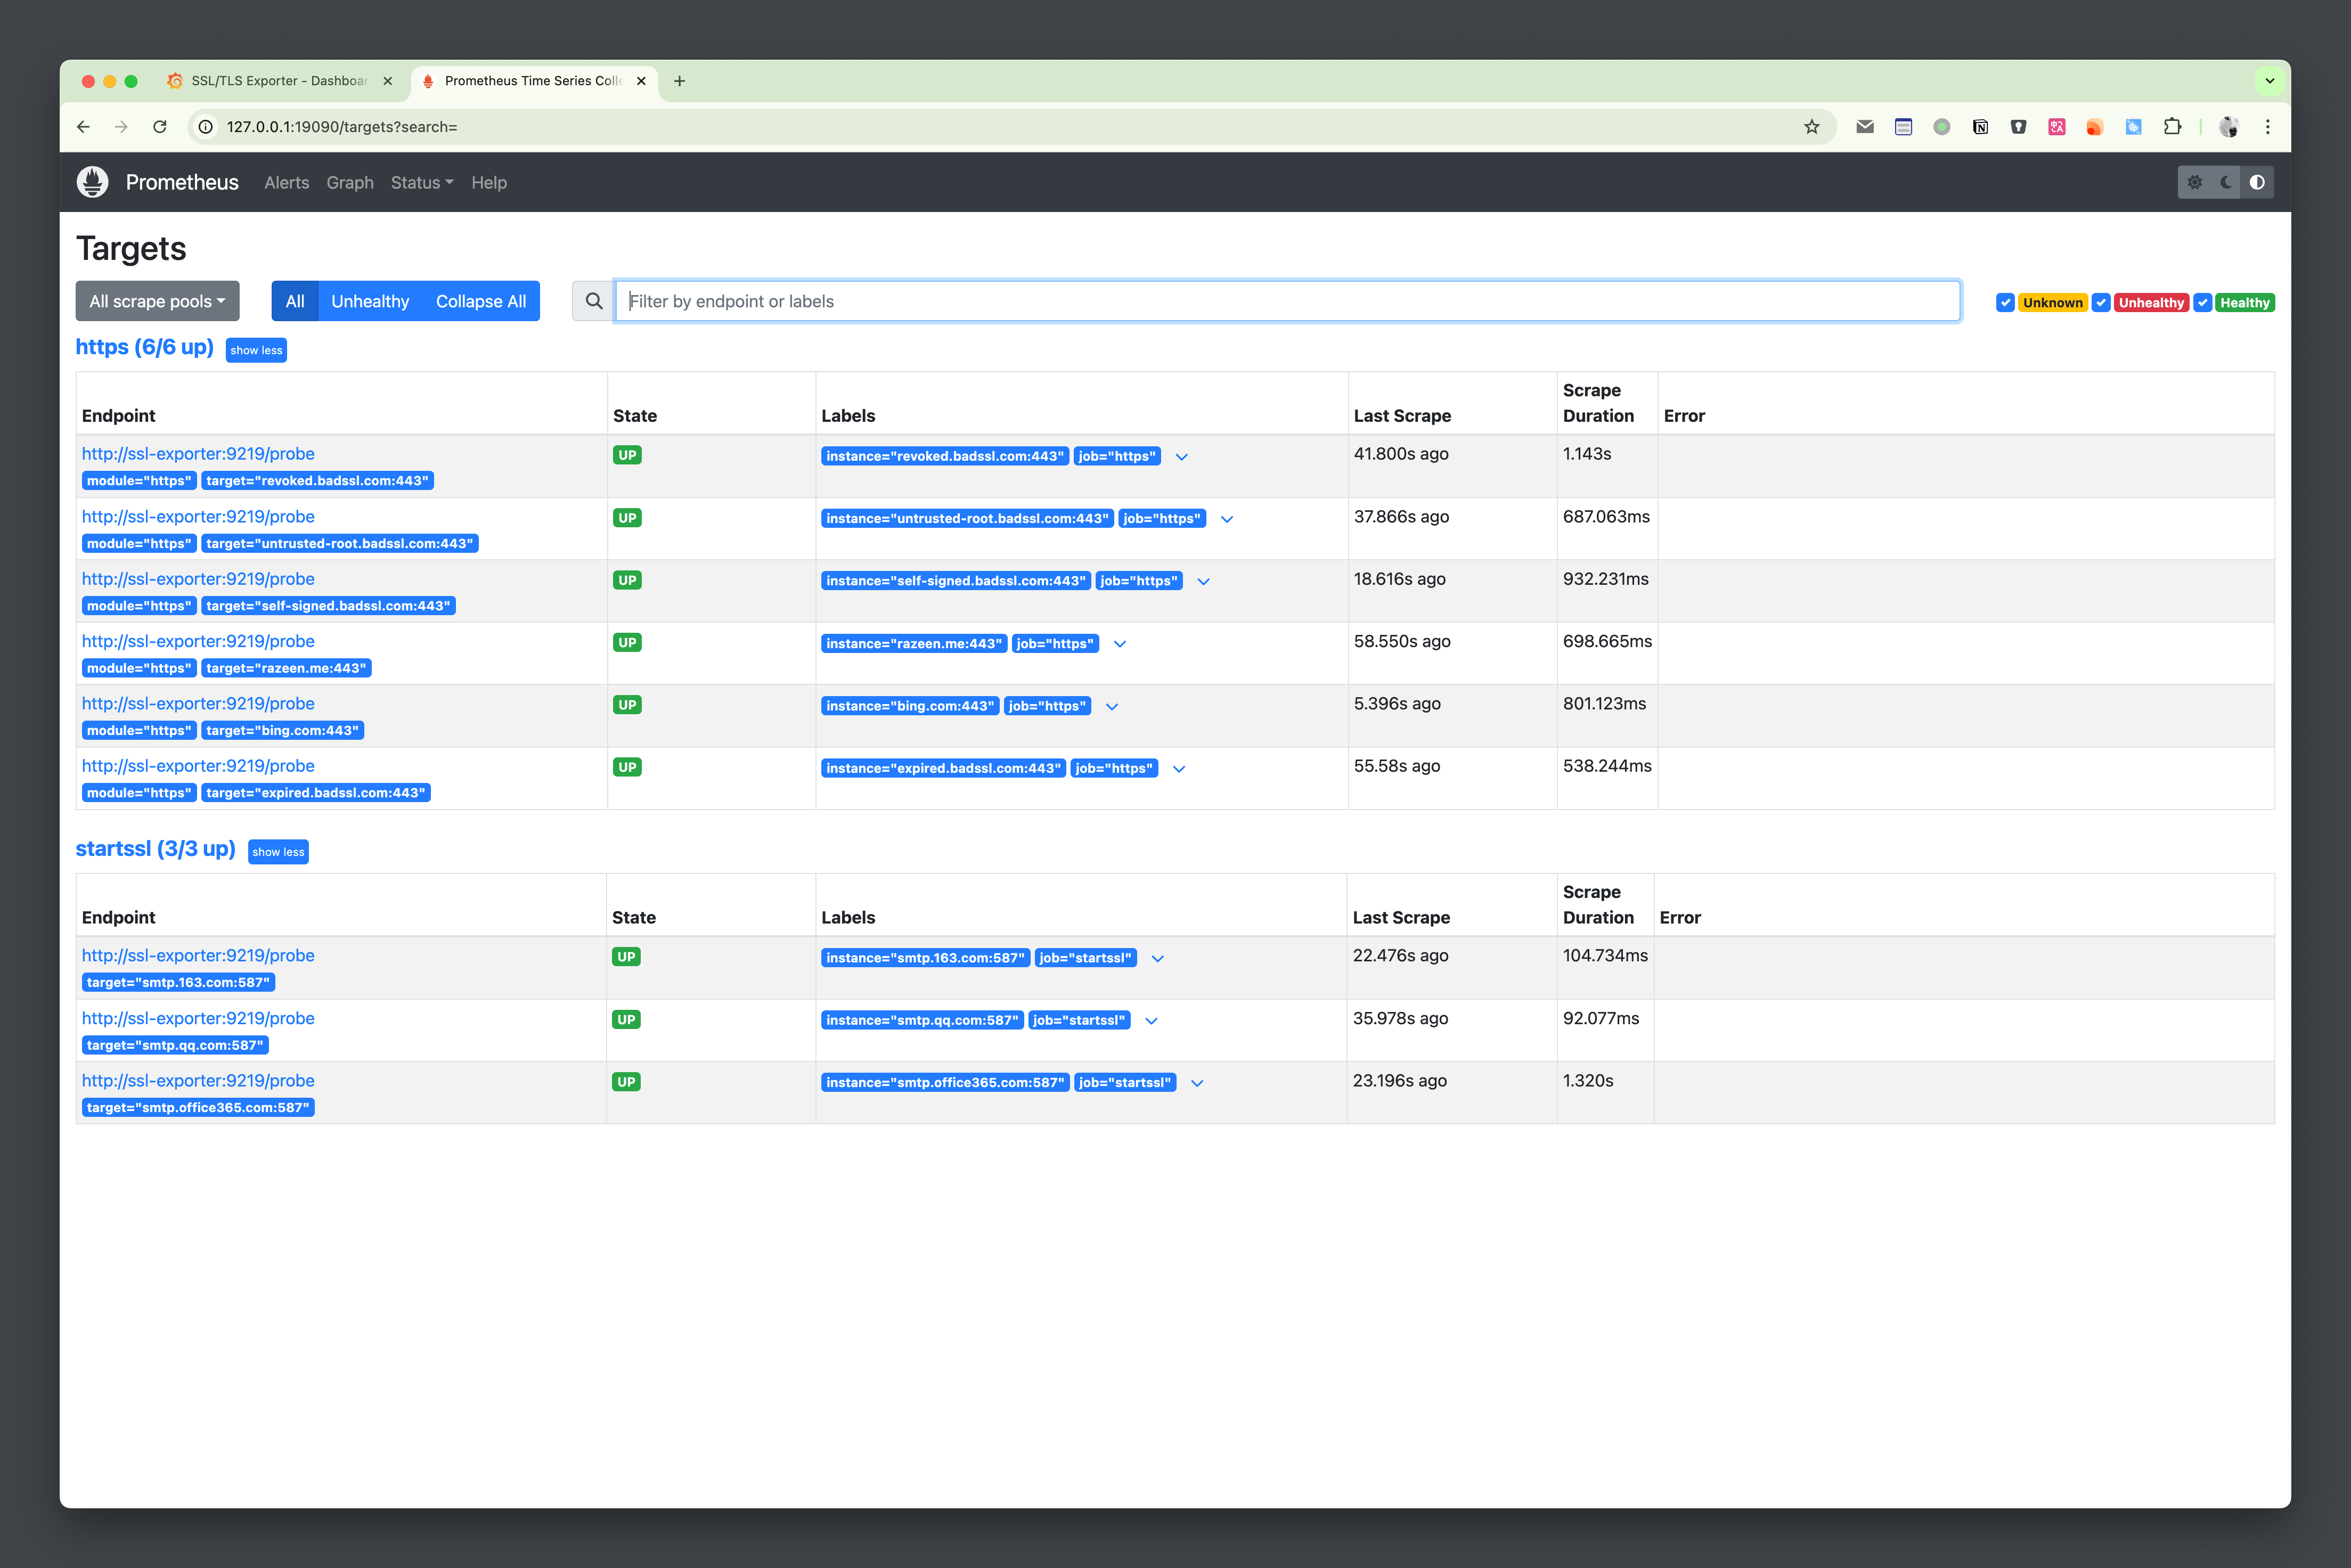
After starting with docker-compose up -d, wait a moment, and you will see all UP in prometheus Status > Targets.
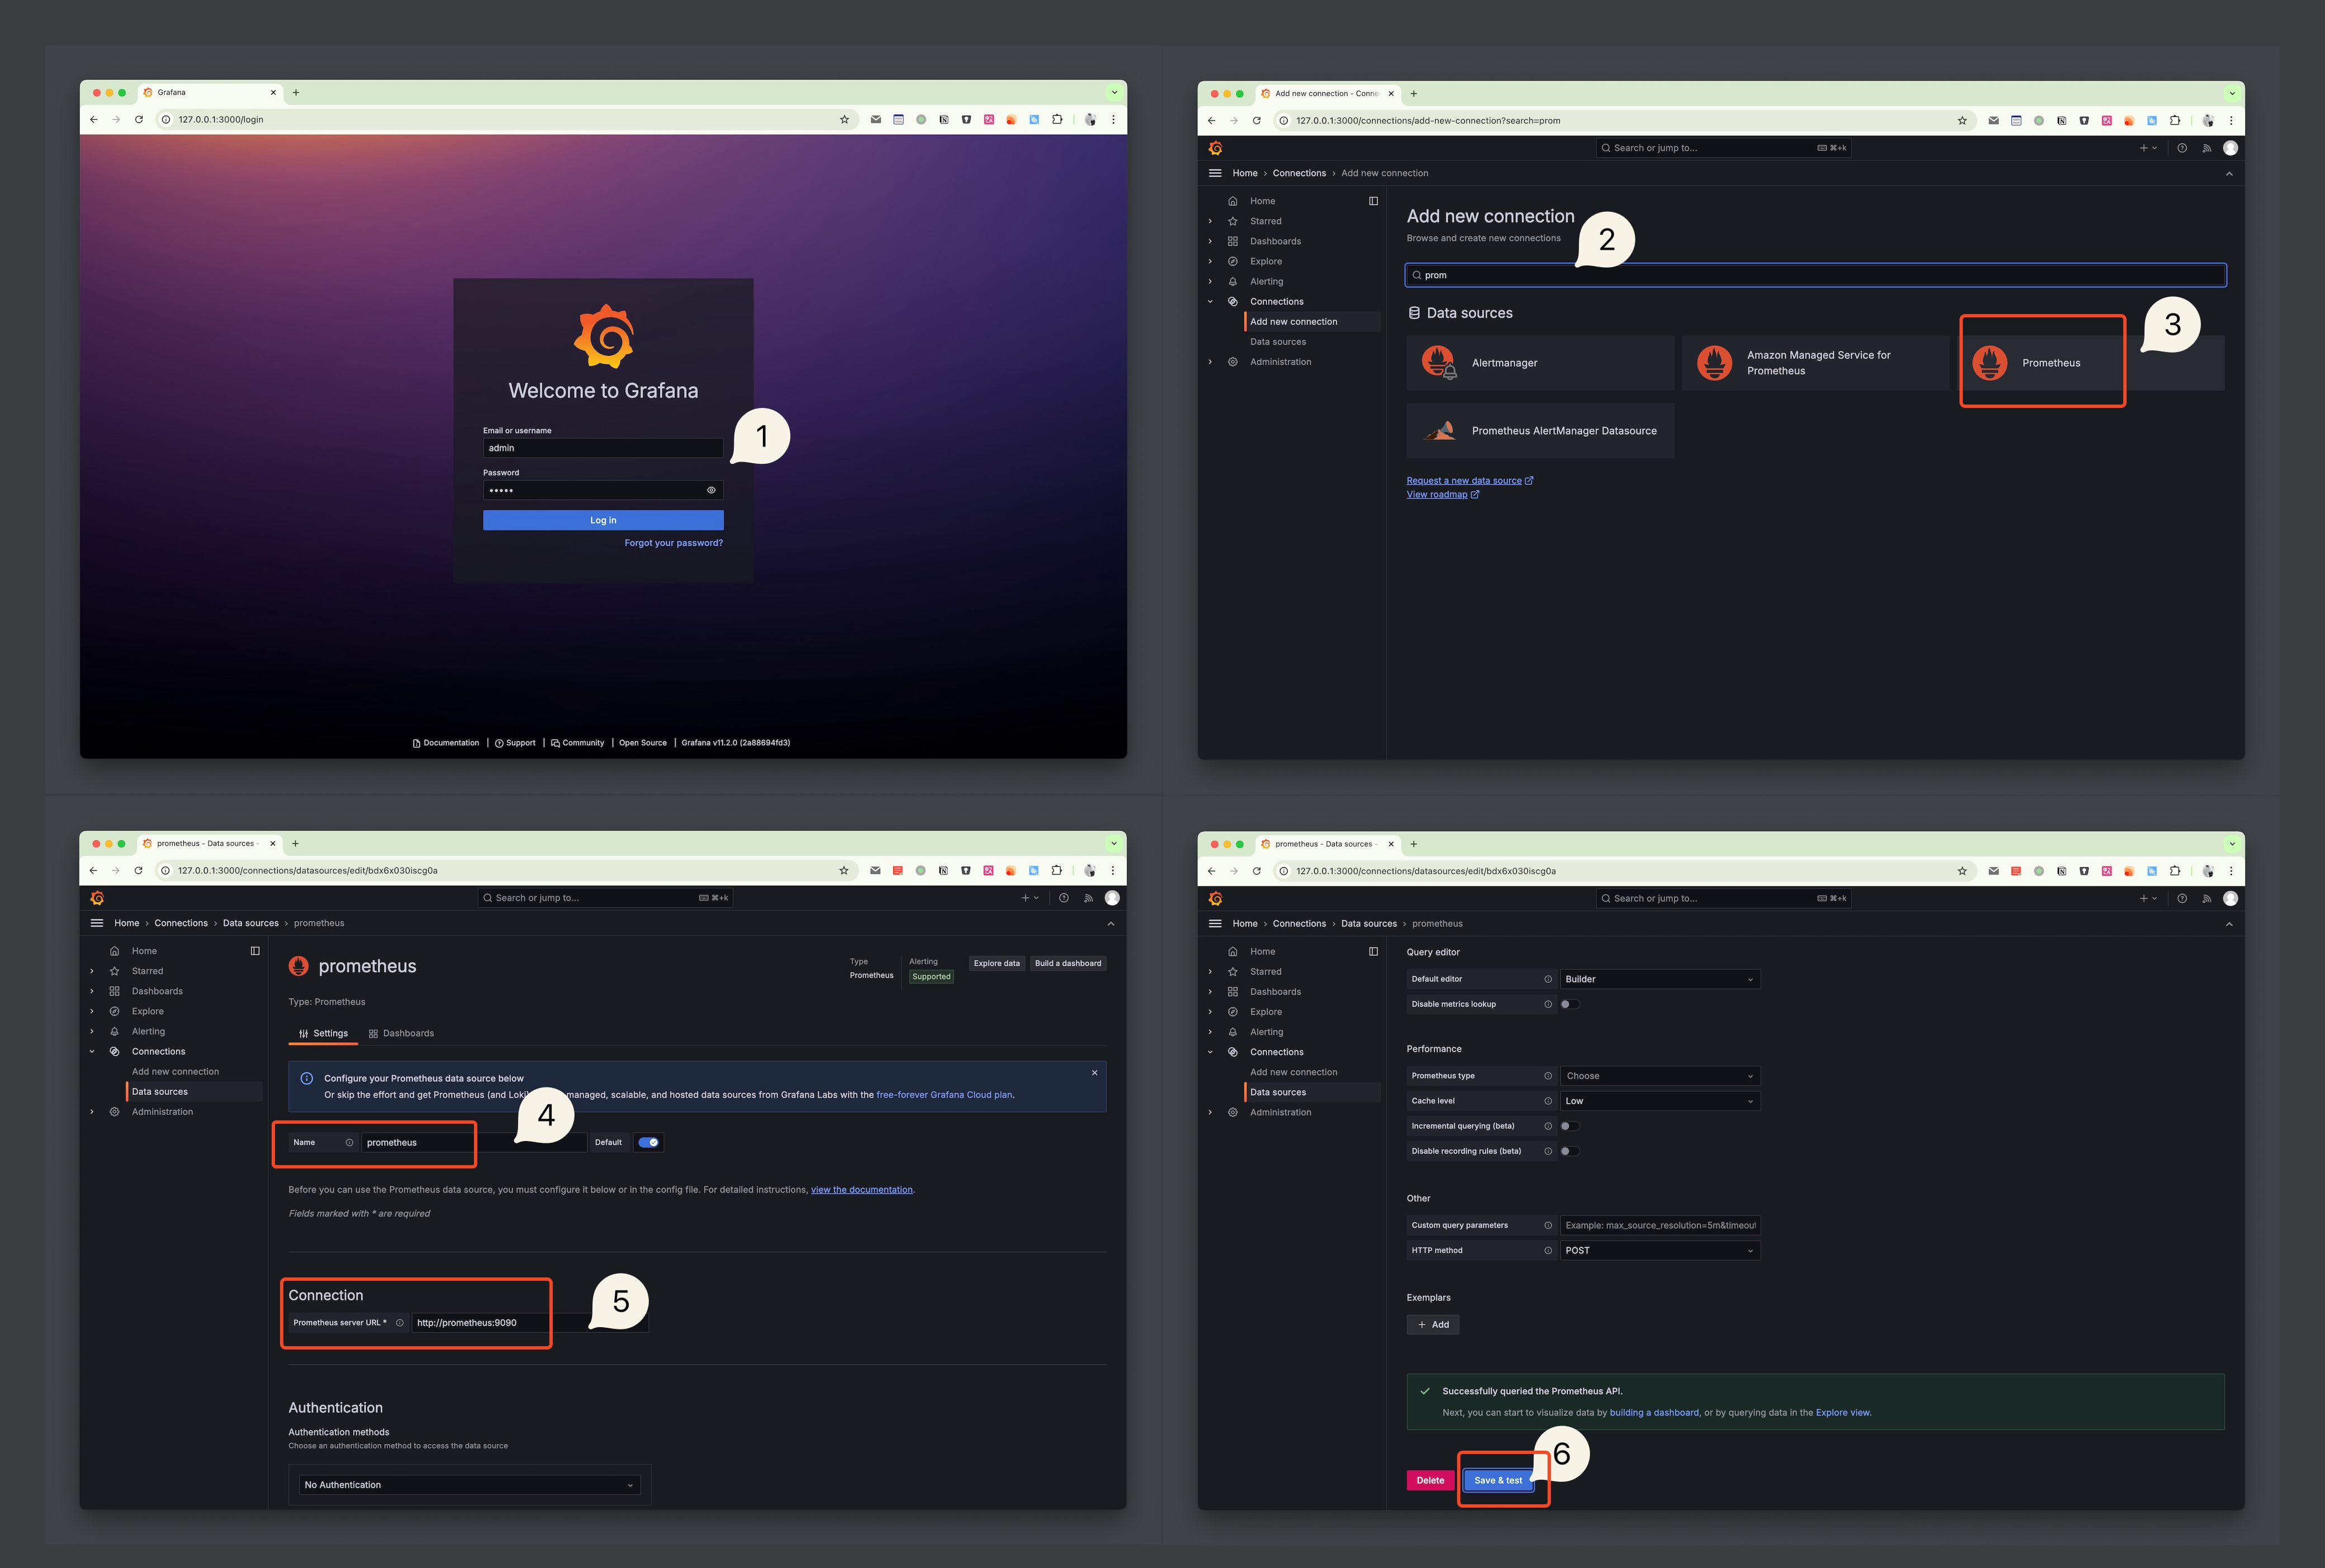
Access Grafana, the initial username and password are both admin. The first login will prompt you to update the password.
- In
Connections > Add new connection, search forprometheusand click to add; - Enter
NameandURL. Since we are in the same docker network, we can connect directly using the label and port, i.e.,http://prometheus:9090
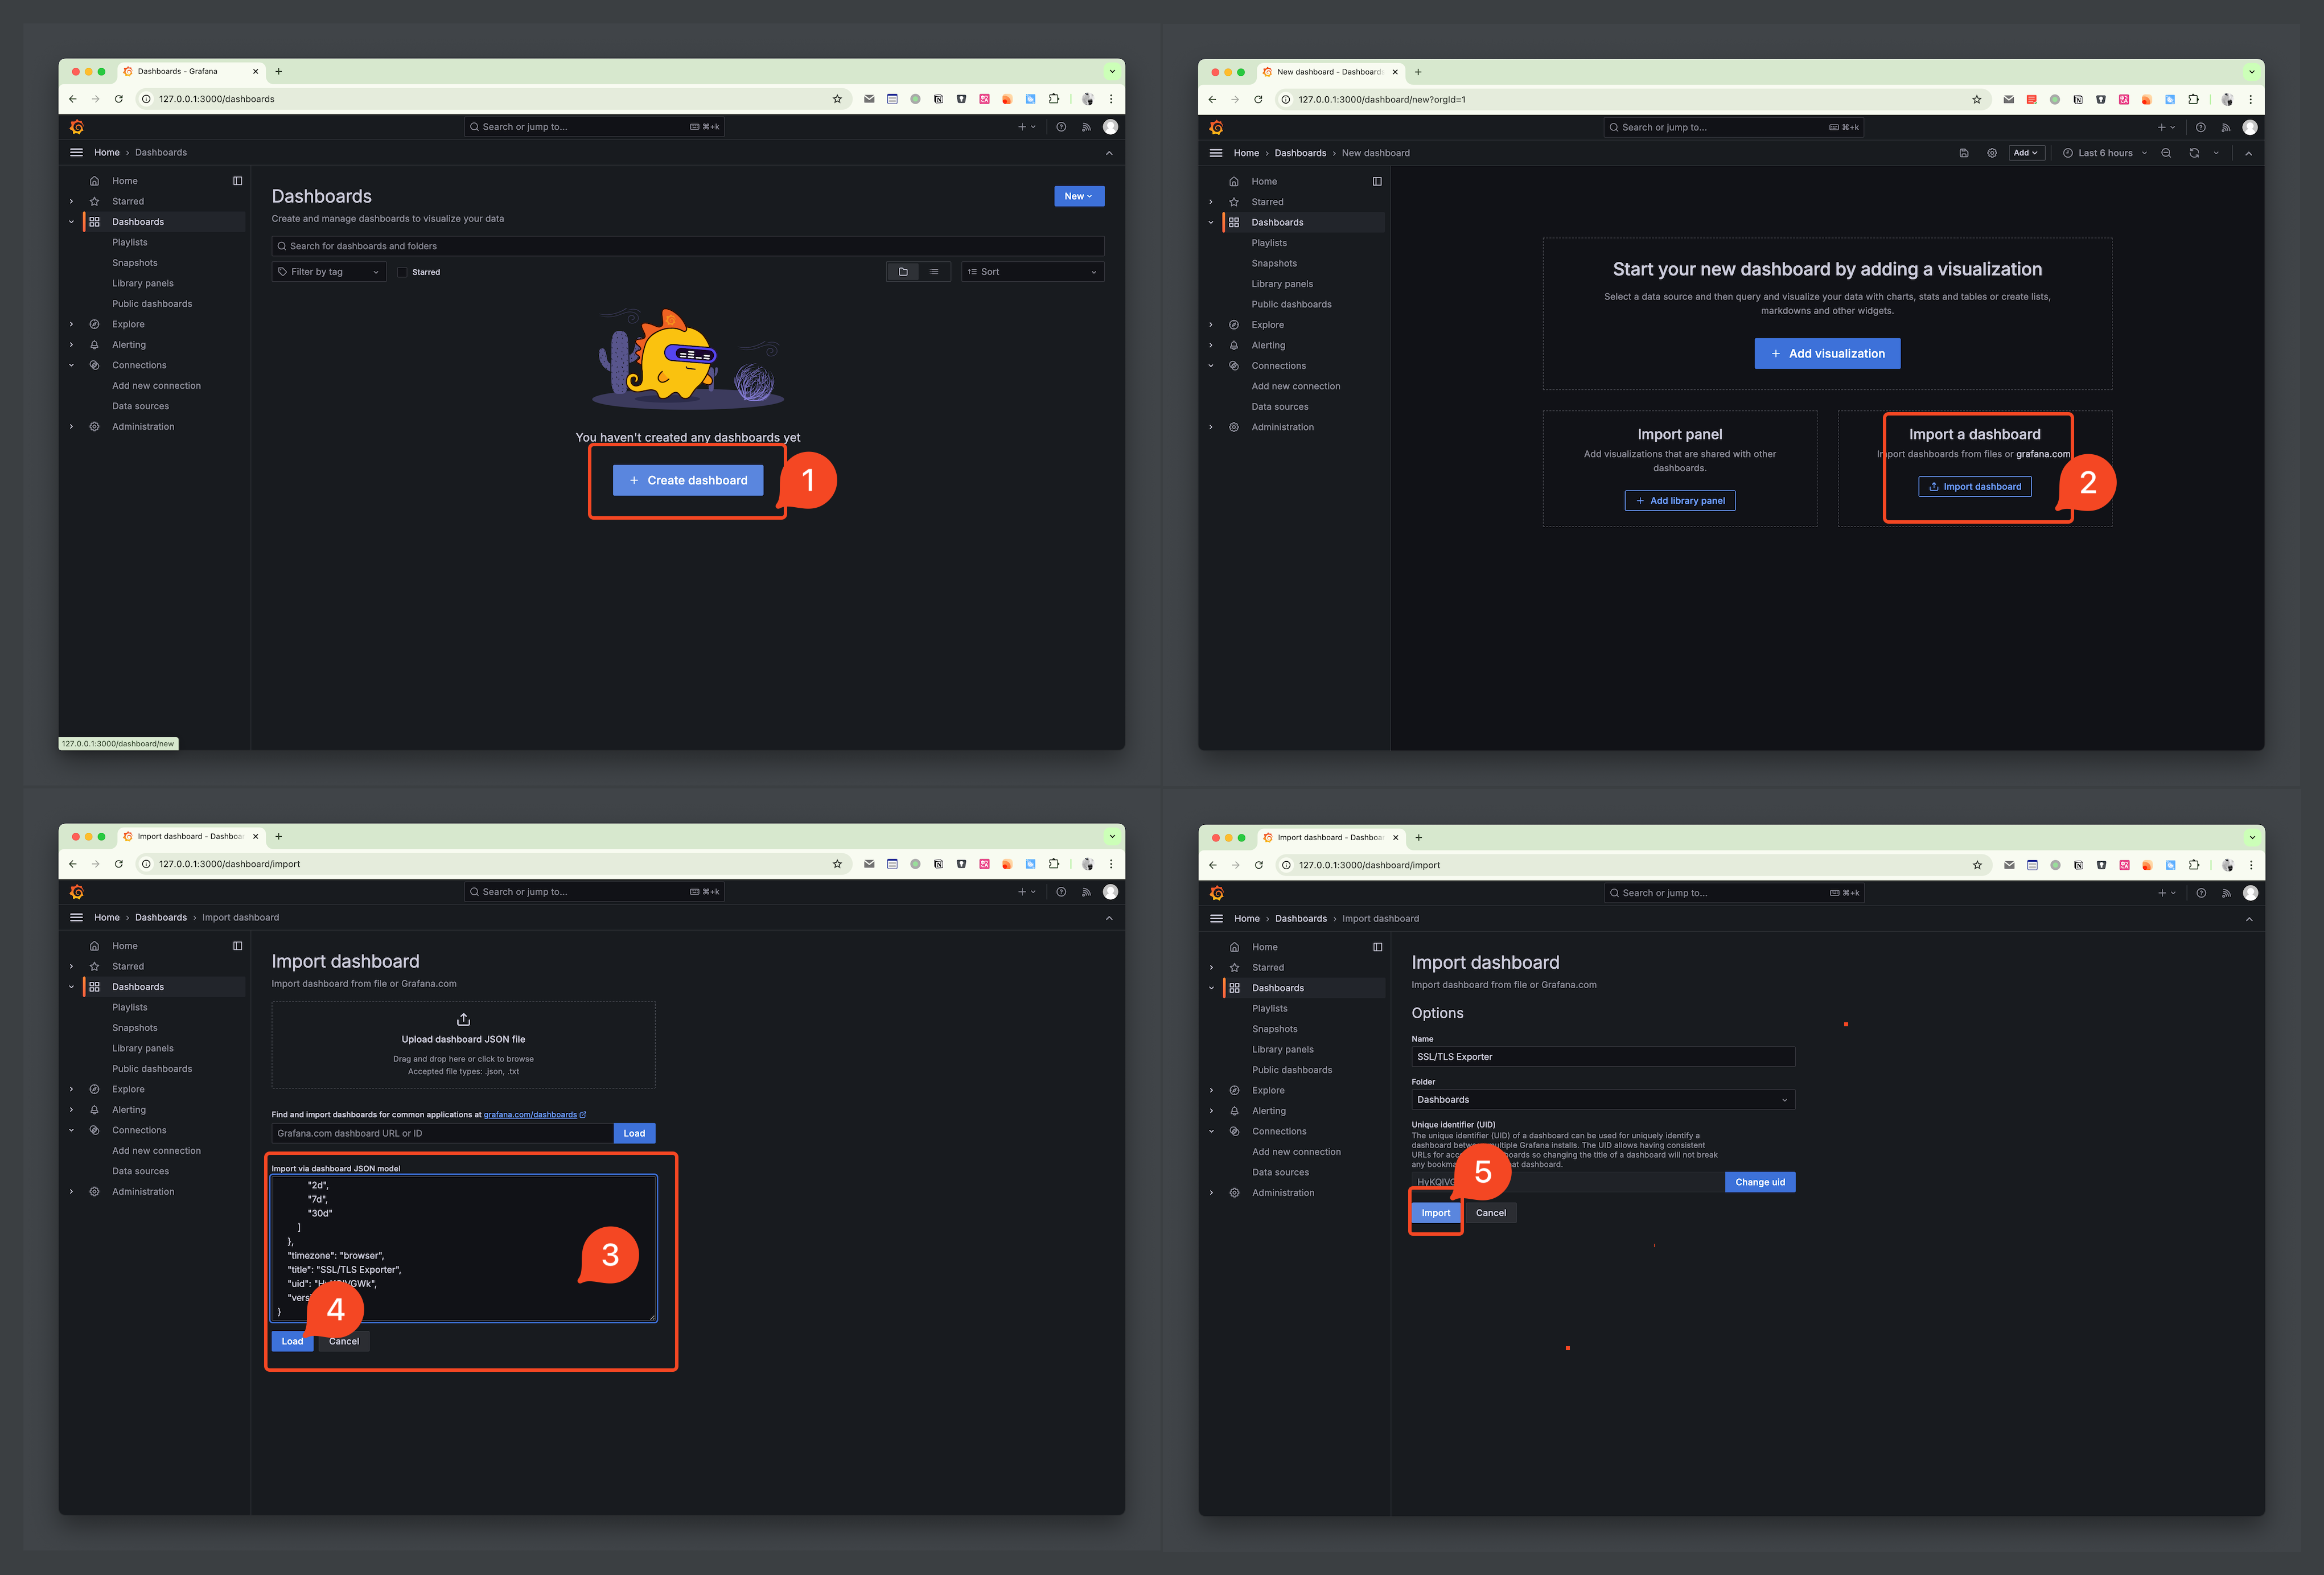
Next, import the dashboard.
- Go to
Dashboardsand import, selectImport a dashboard - Copy dashboard.json, paste and
Load, thenImport
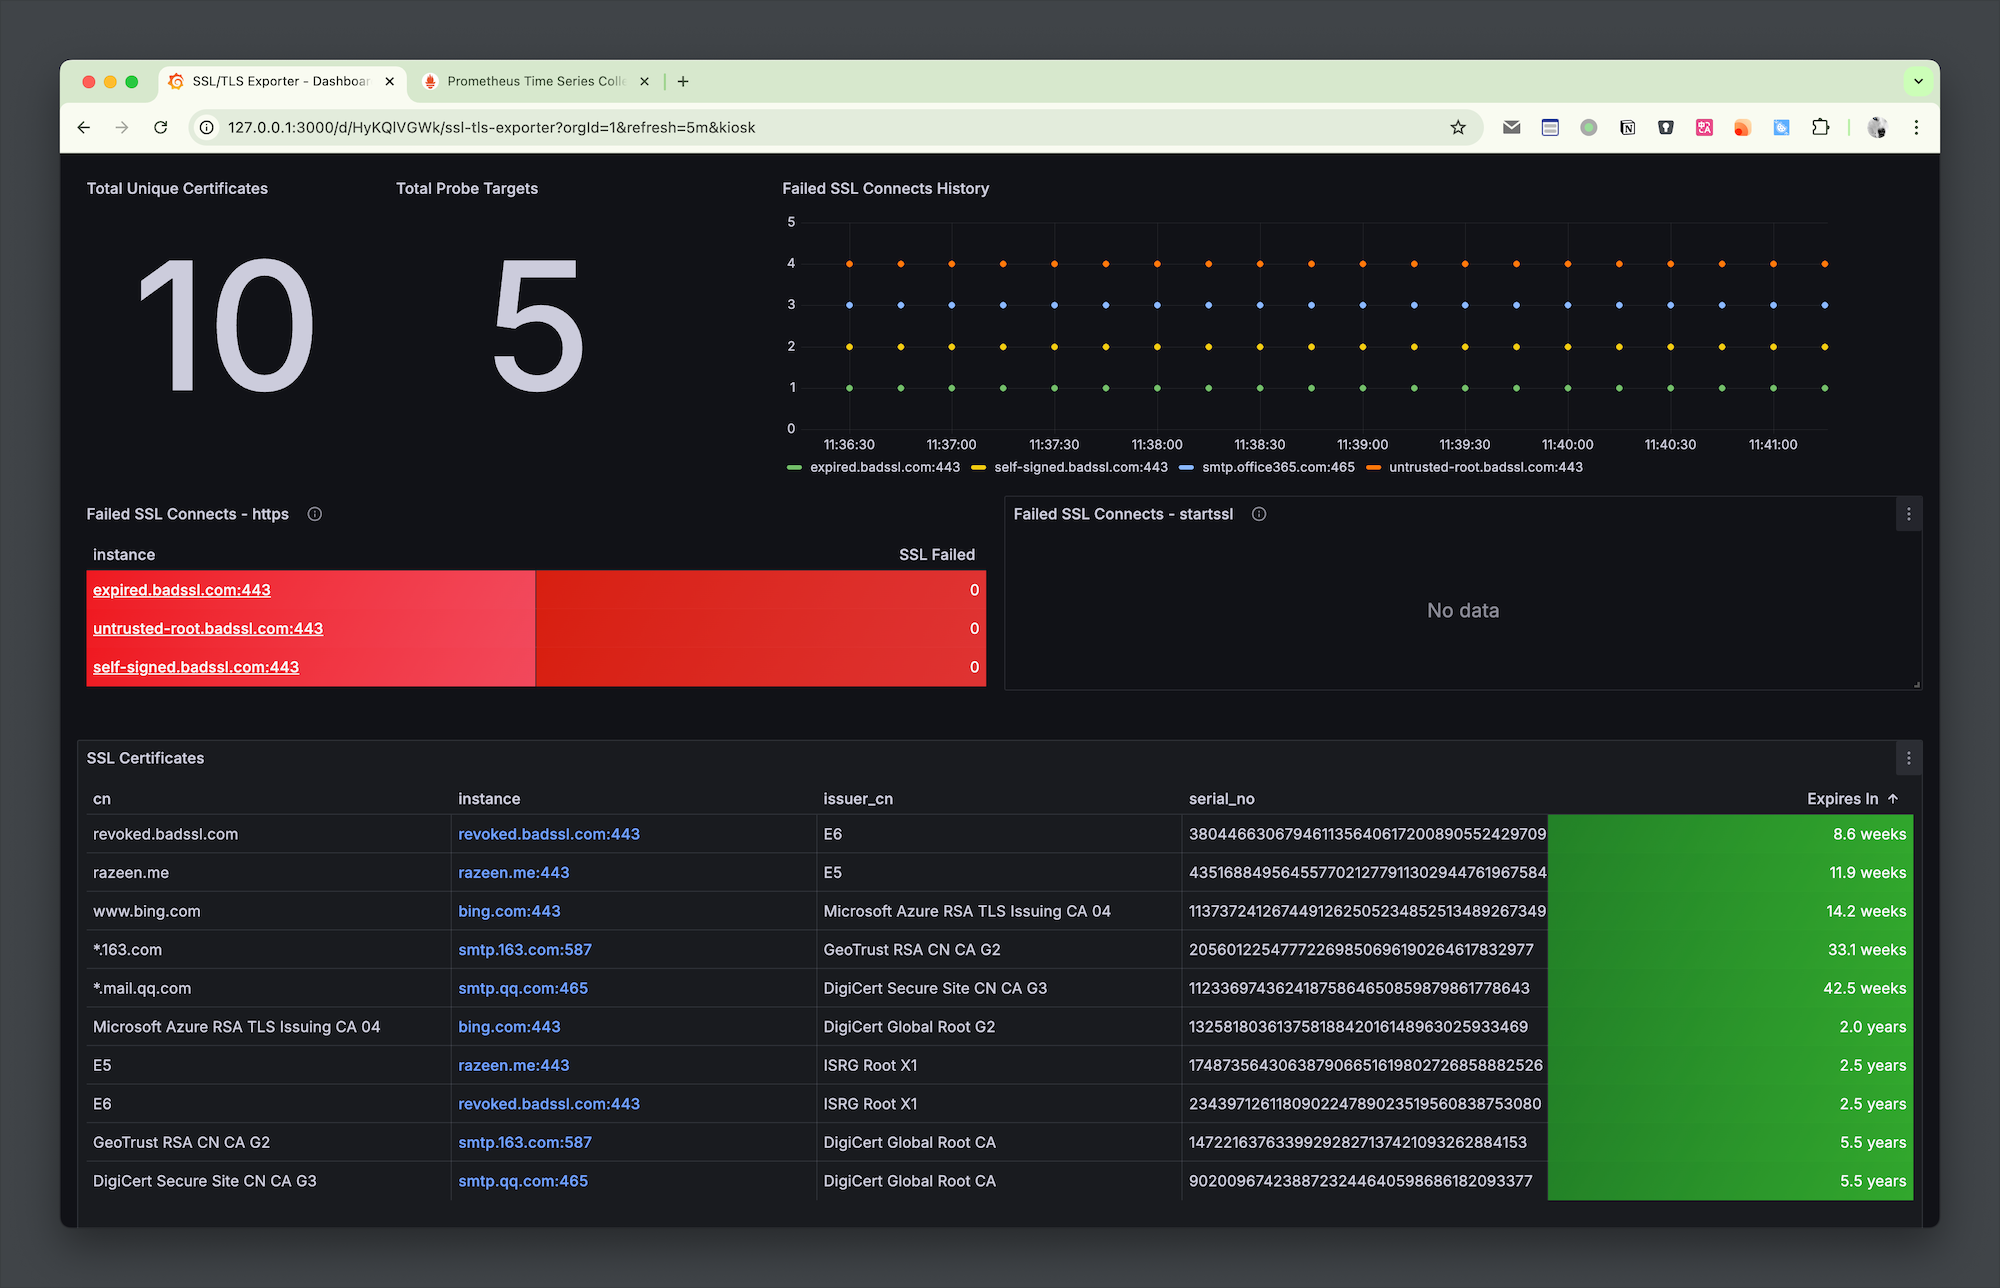
At this point, you can see the dashboard shown at the beginning of the blog.
Summary
Through this dashboard, the certificate information of the site can be conveniently aggregated and displayed. If it expires, it can be seen at a glance. At the same time, if needed, you can set alert rules based on the expiration time metric to achieve certificate expiration notifications.
However, there are some shortcomings. I added some revoked certificates and self-signed sites, which cannot be distinguished here, so it cannot be relied upon for very professional monitoring. For professional management and monitoring, you can try CertCloud.